AI Clinical Adherence & Data Visualization

My Role — Lead Product Designer · HAKEA for AiCure · 12 months · Deliverables: multi-role UX research, clinical dashboard, patient-facing app, app map, user archetypes, journey maps
The Problem
AiCure had built impressive computer vision technology for monitoring medication adherence in clinical trials — but no platform to make that data useful. Clinical teams were managing patients through phone calls and weekly email updates. The data existed. The insight didn't. HAKEA was brought in to design a clinical dashboard and patient-facing app for a complex, multi-role user base — from patients and nurses through to medical directors and trial sponsors.
The Research Approach
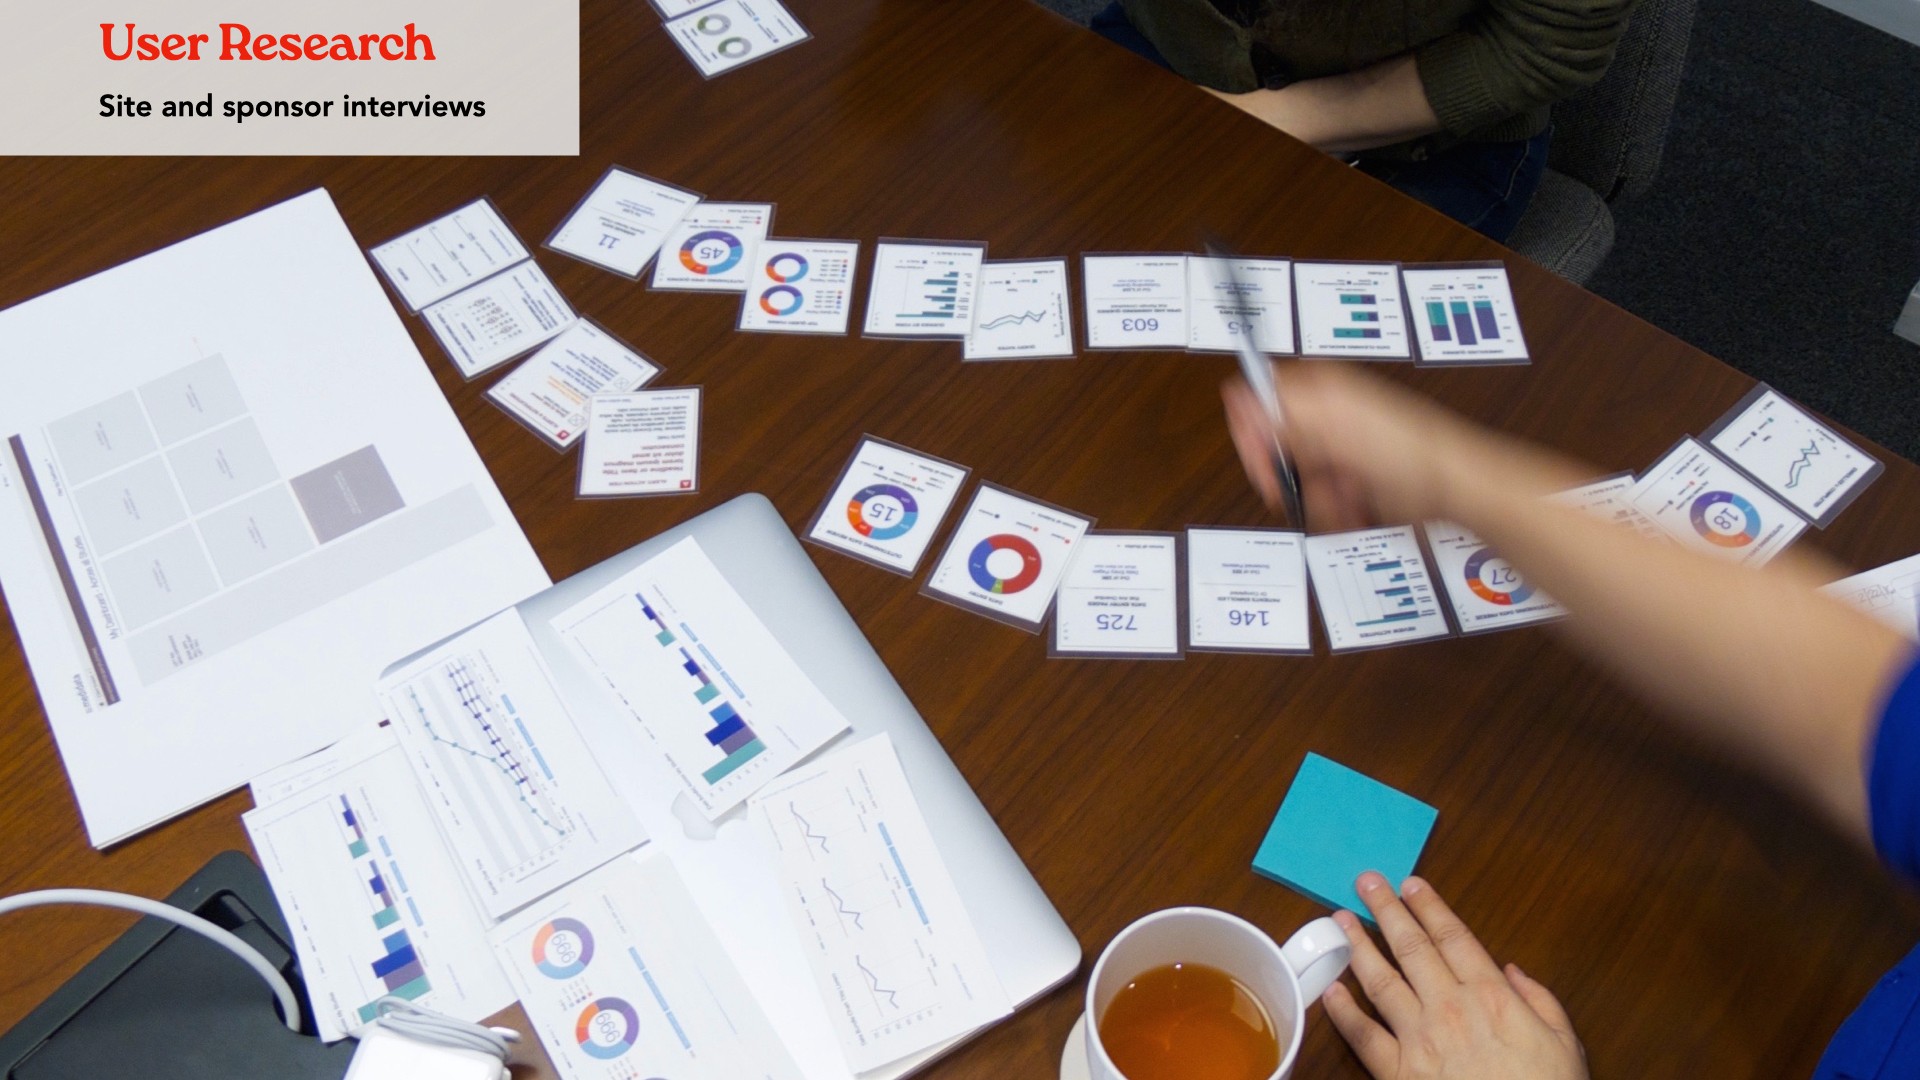
Rather than defaulting to the industry convention of five-user testing, I designed for broader coverage — drawing on evidence that small samples miss significant proportions of real user problems. Research ran across three parallel tracks: established data visualization theory and academic frameworks; competitive analysis mapped directly onto the user journey; and direct interviews across three user groups — patients managing complex medication regimes, site personnel supervising patients, and sponsors and medical directors overseeing multi-site trials.
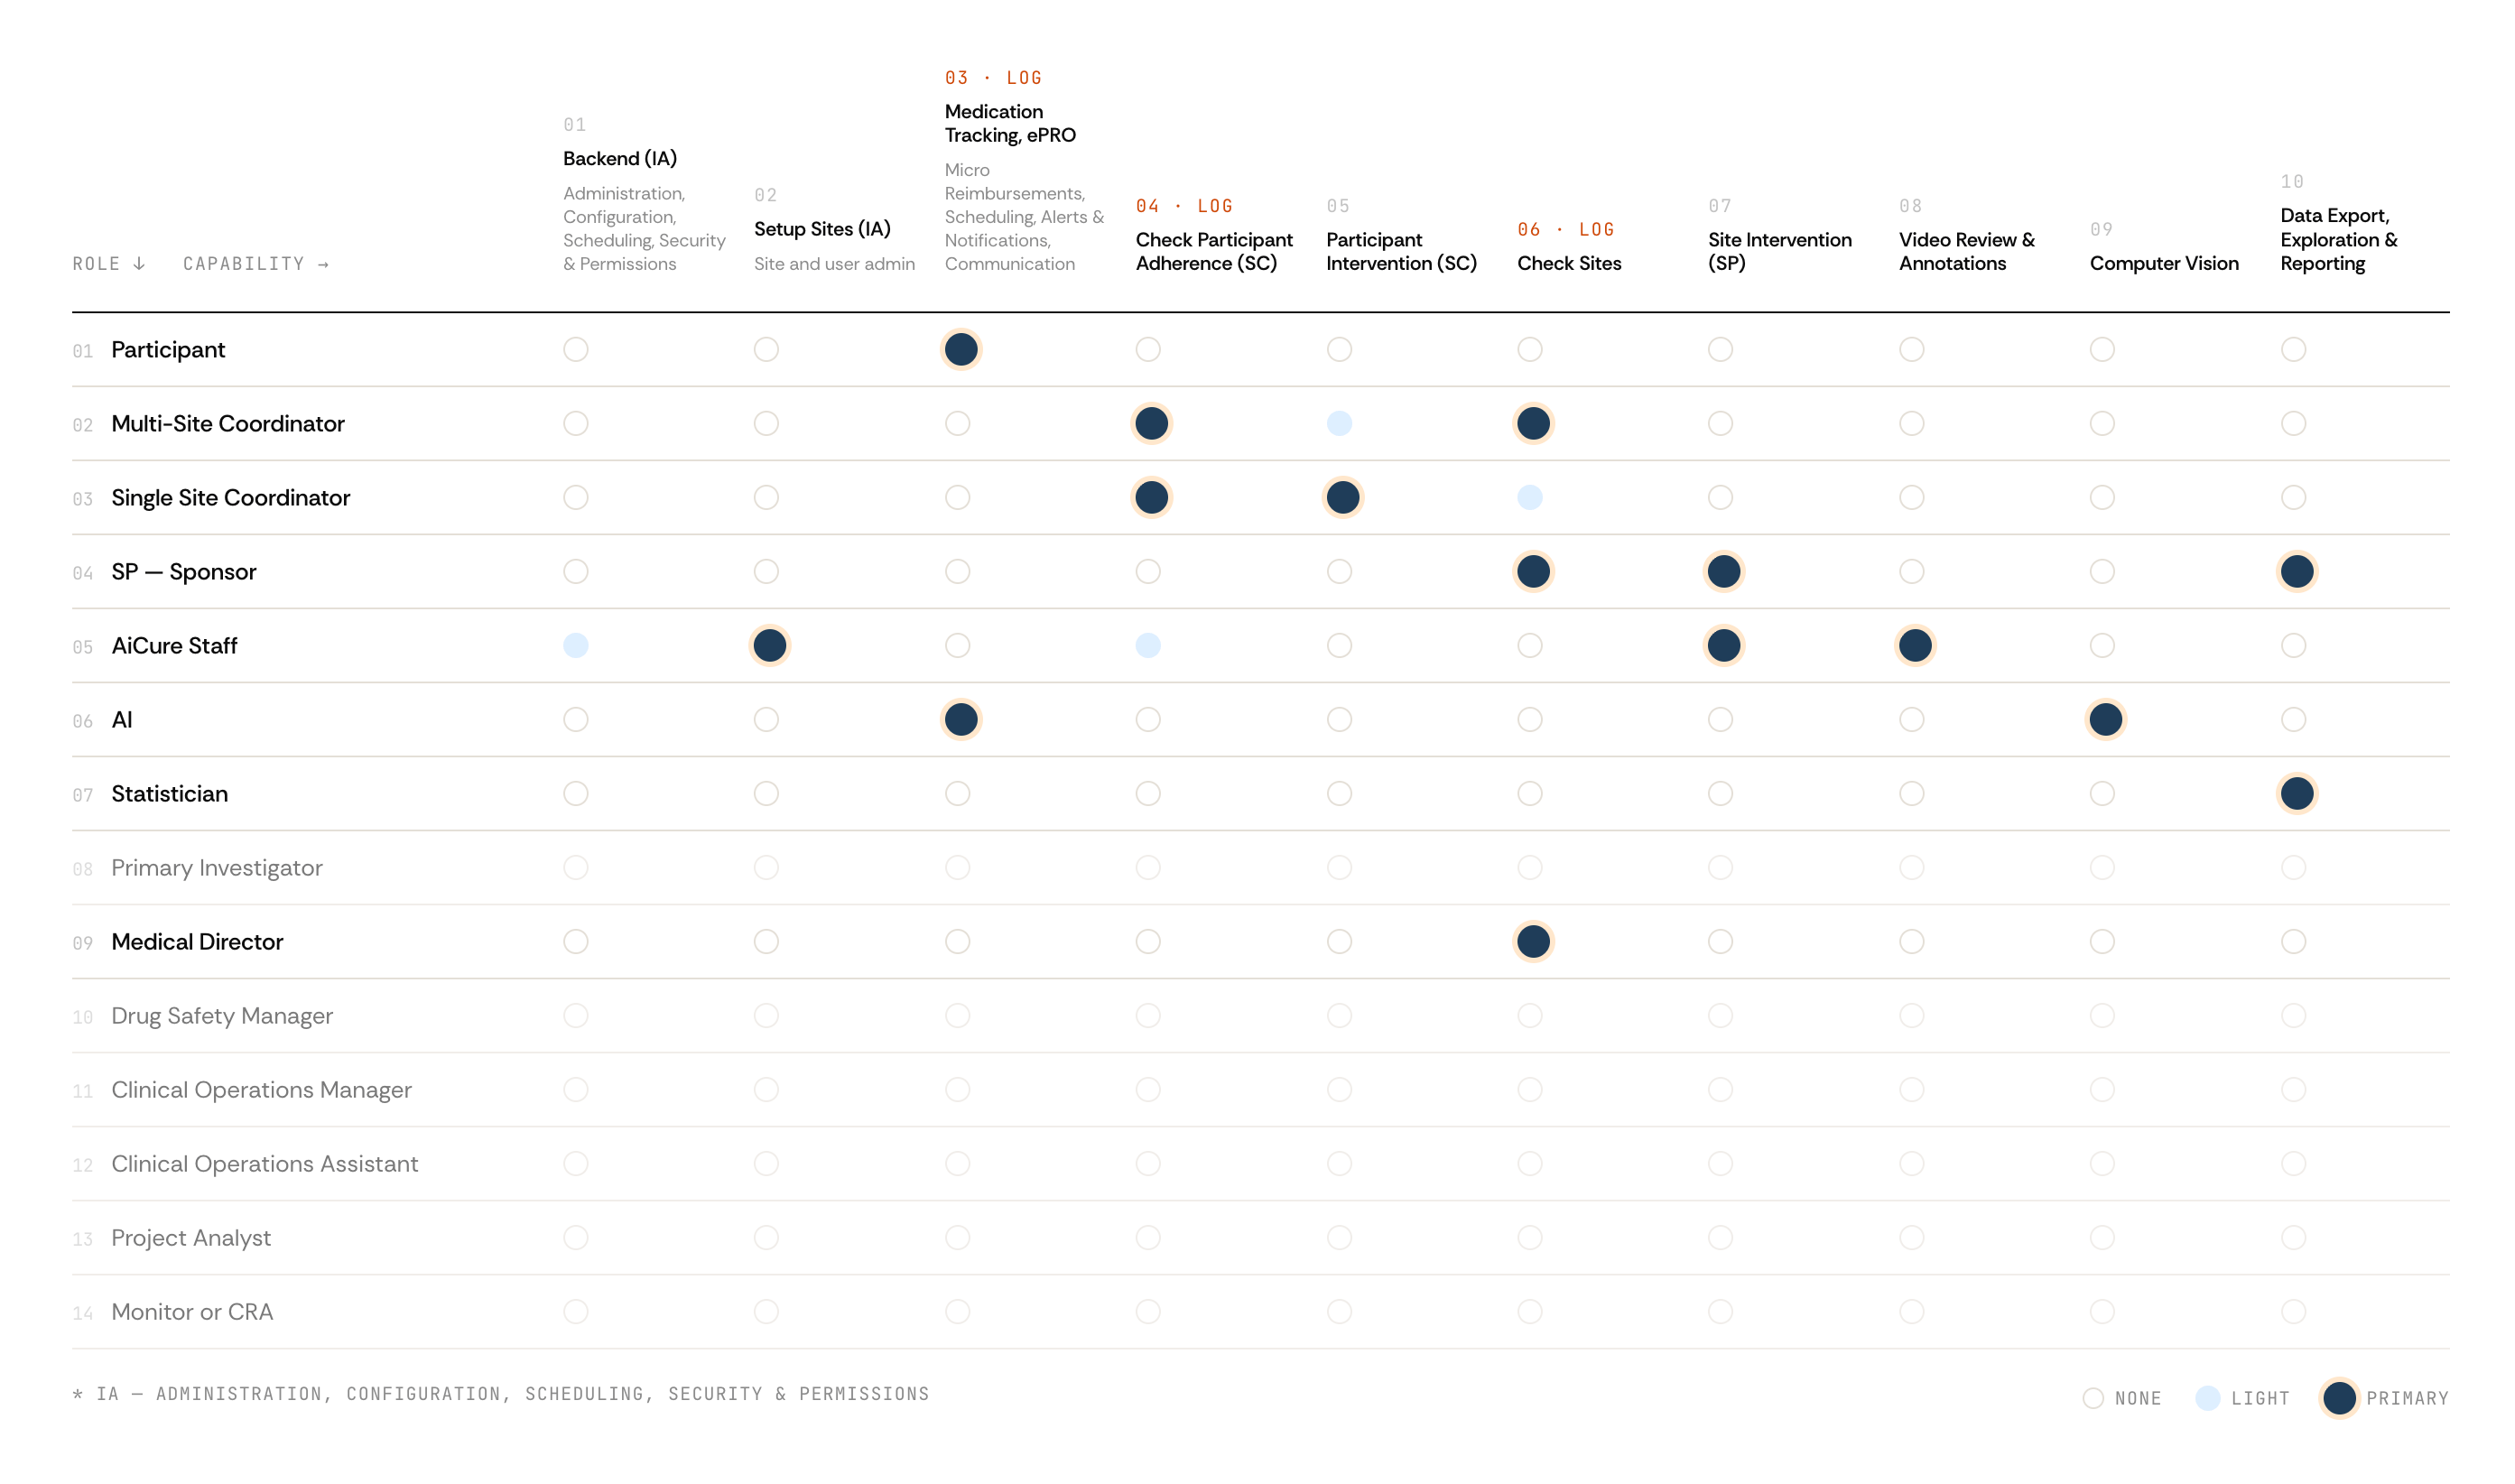
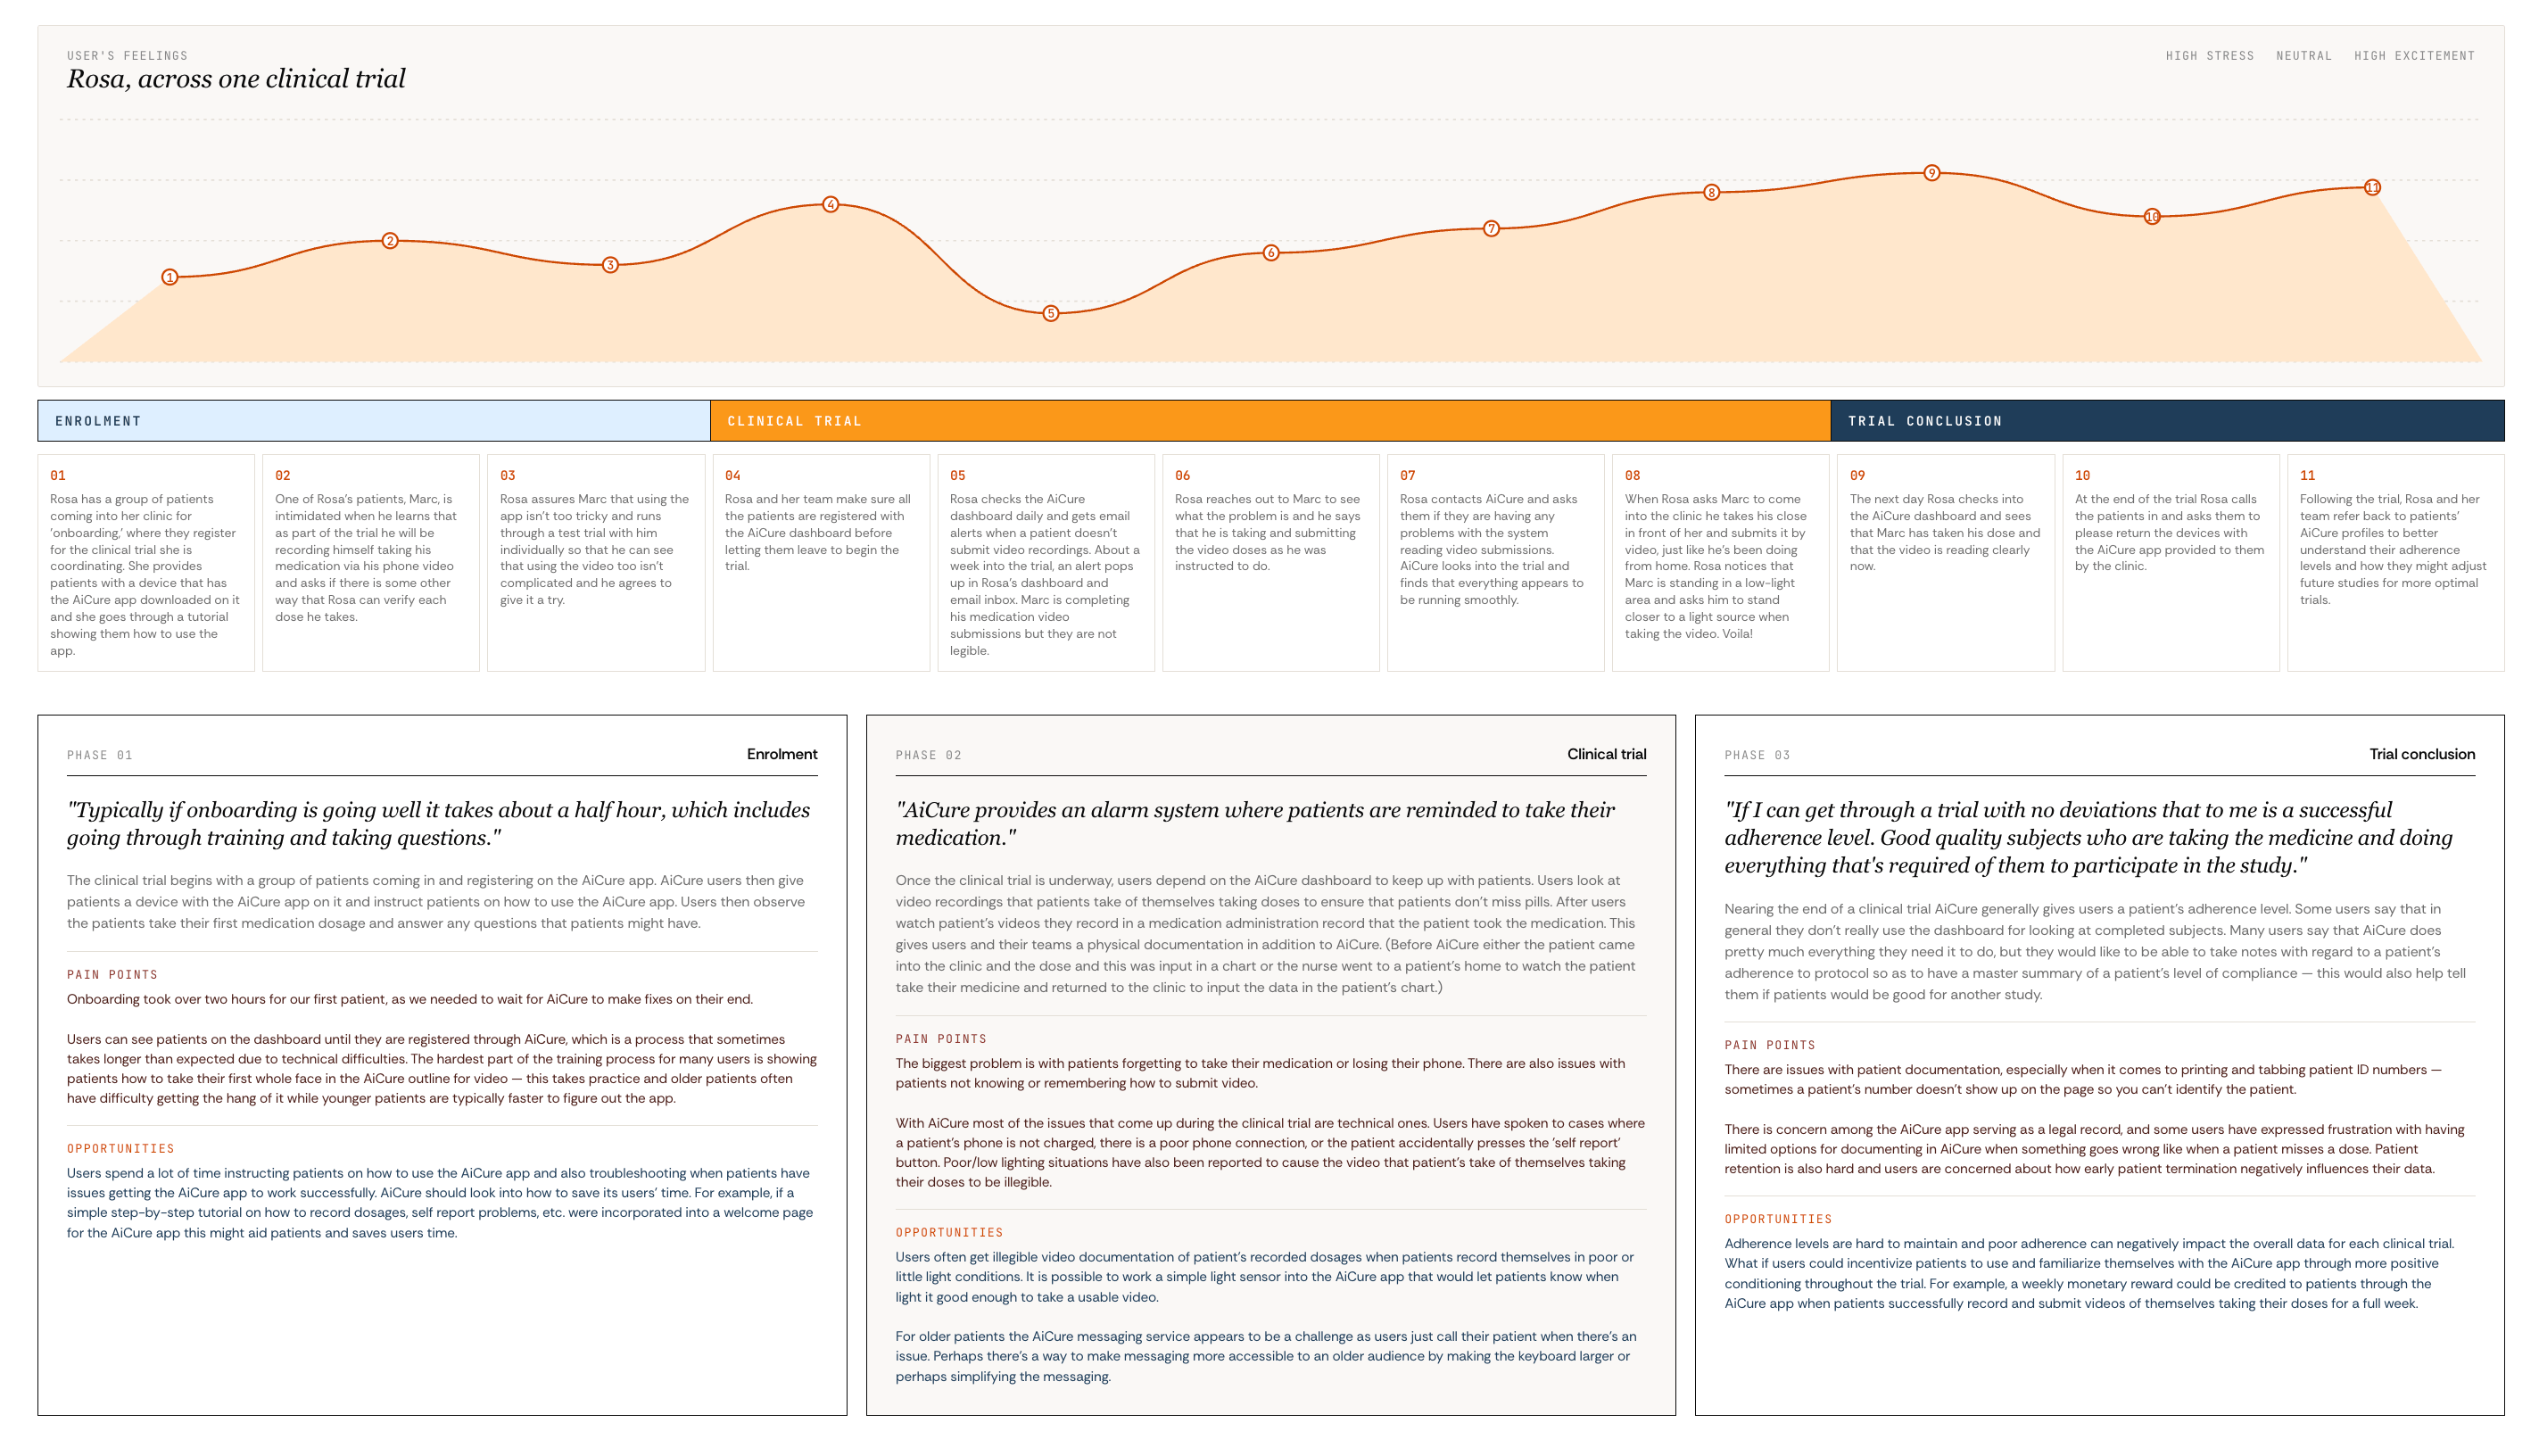
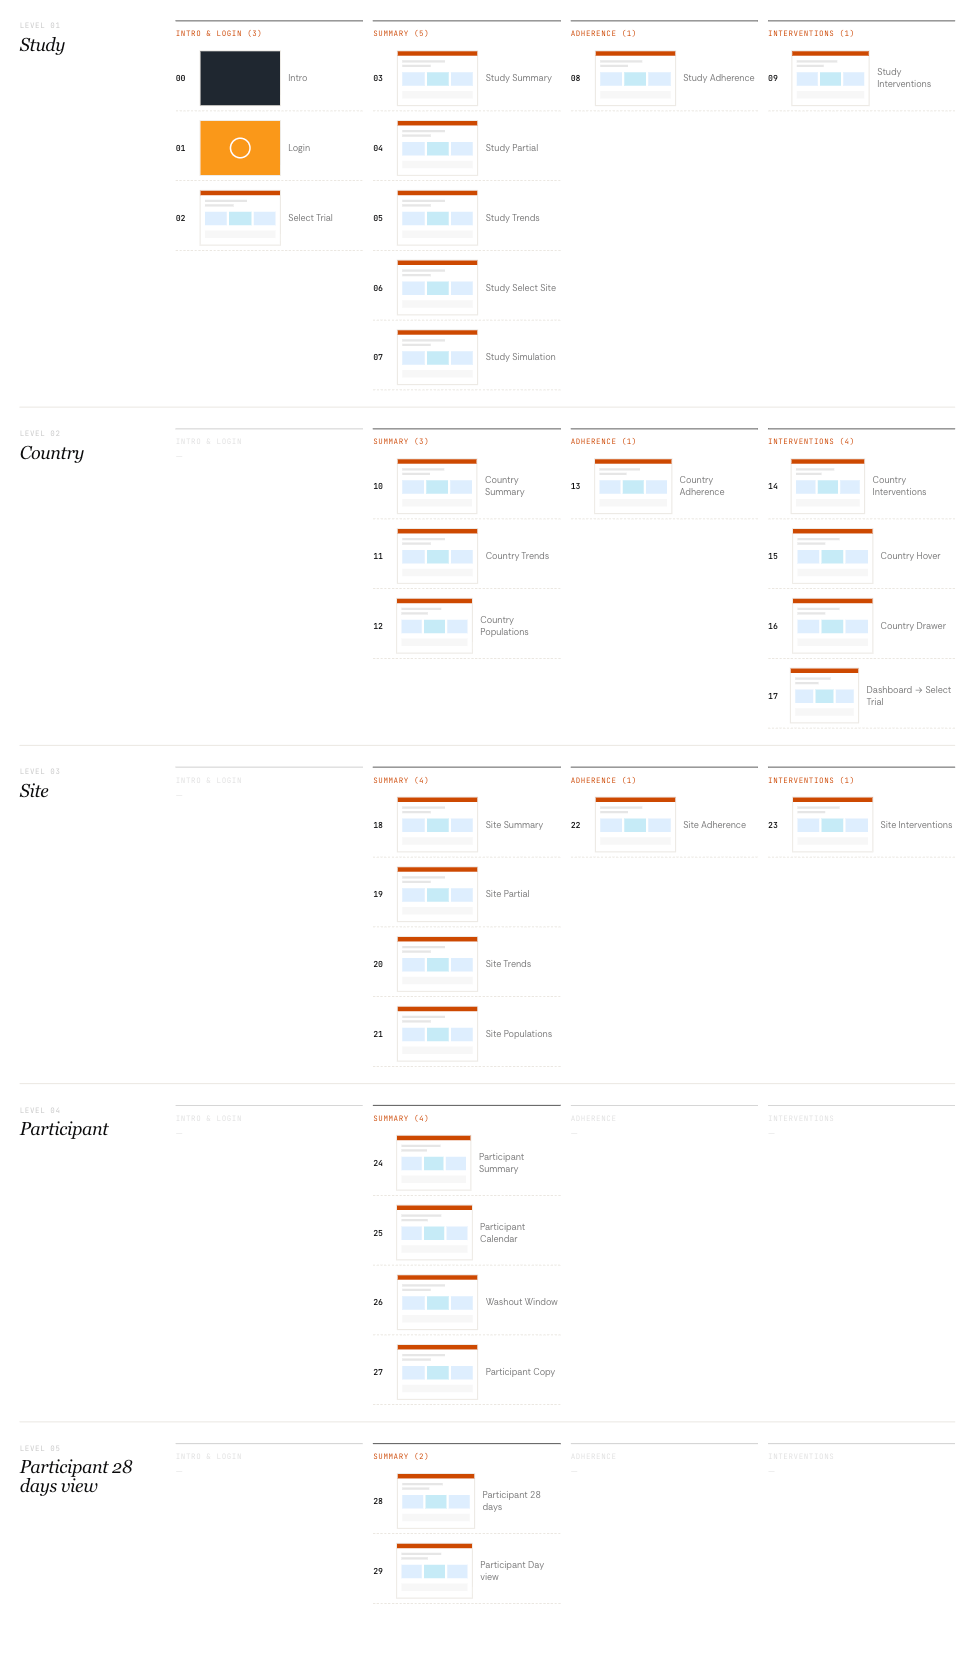
From the research I produced affinity maps, user journey maps, detailed archetypes, and a comprehensive app map with feature recommendations.
Across all user groups, five shared needs emerged: population adherence at a glance, individual patient tracking, future trend prediction, difficulty identification across sites, and intervention management.
The Design Response
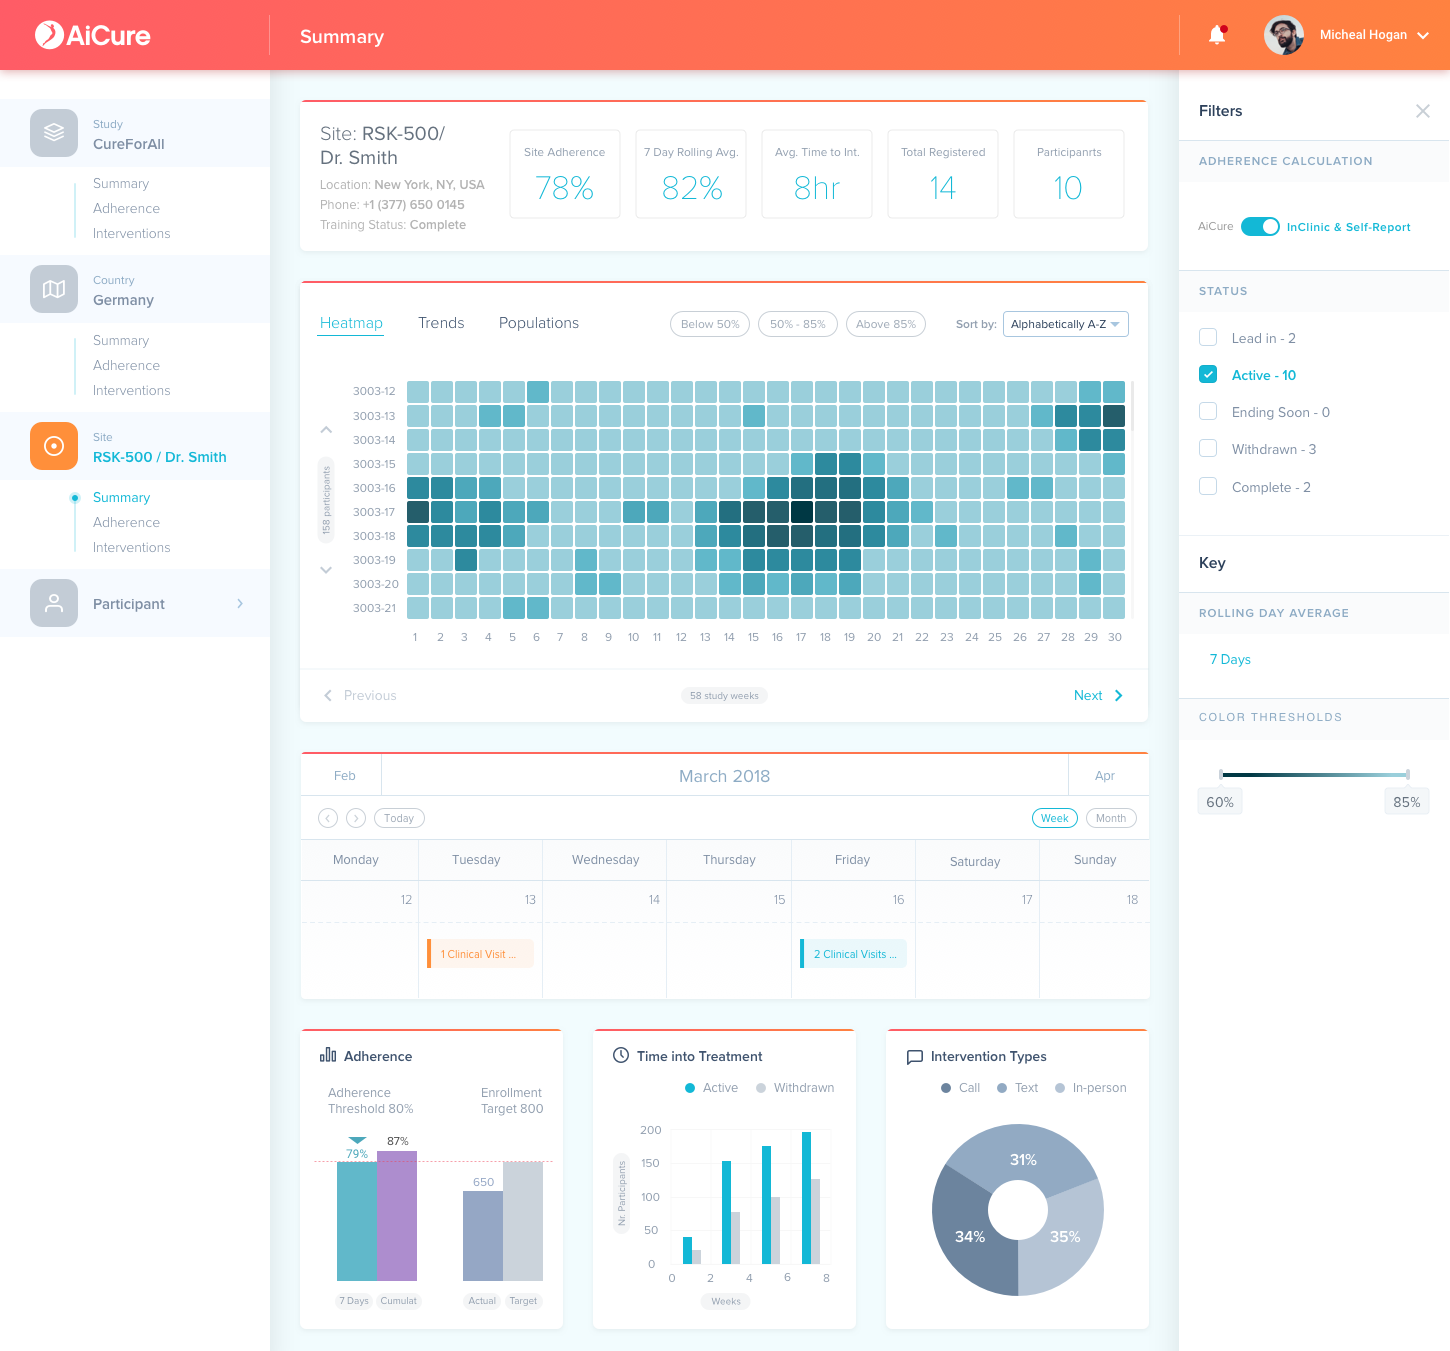
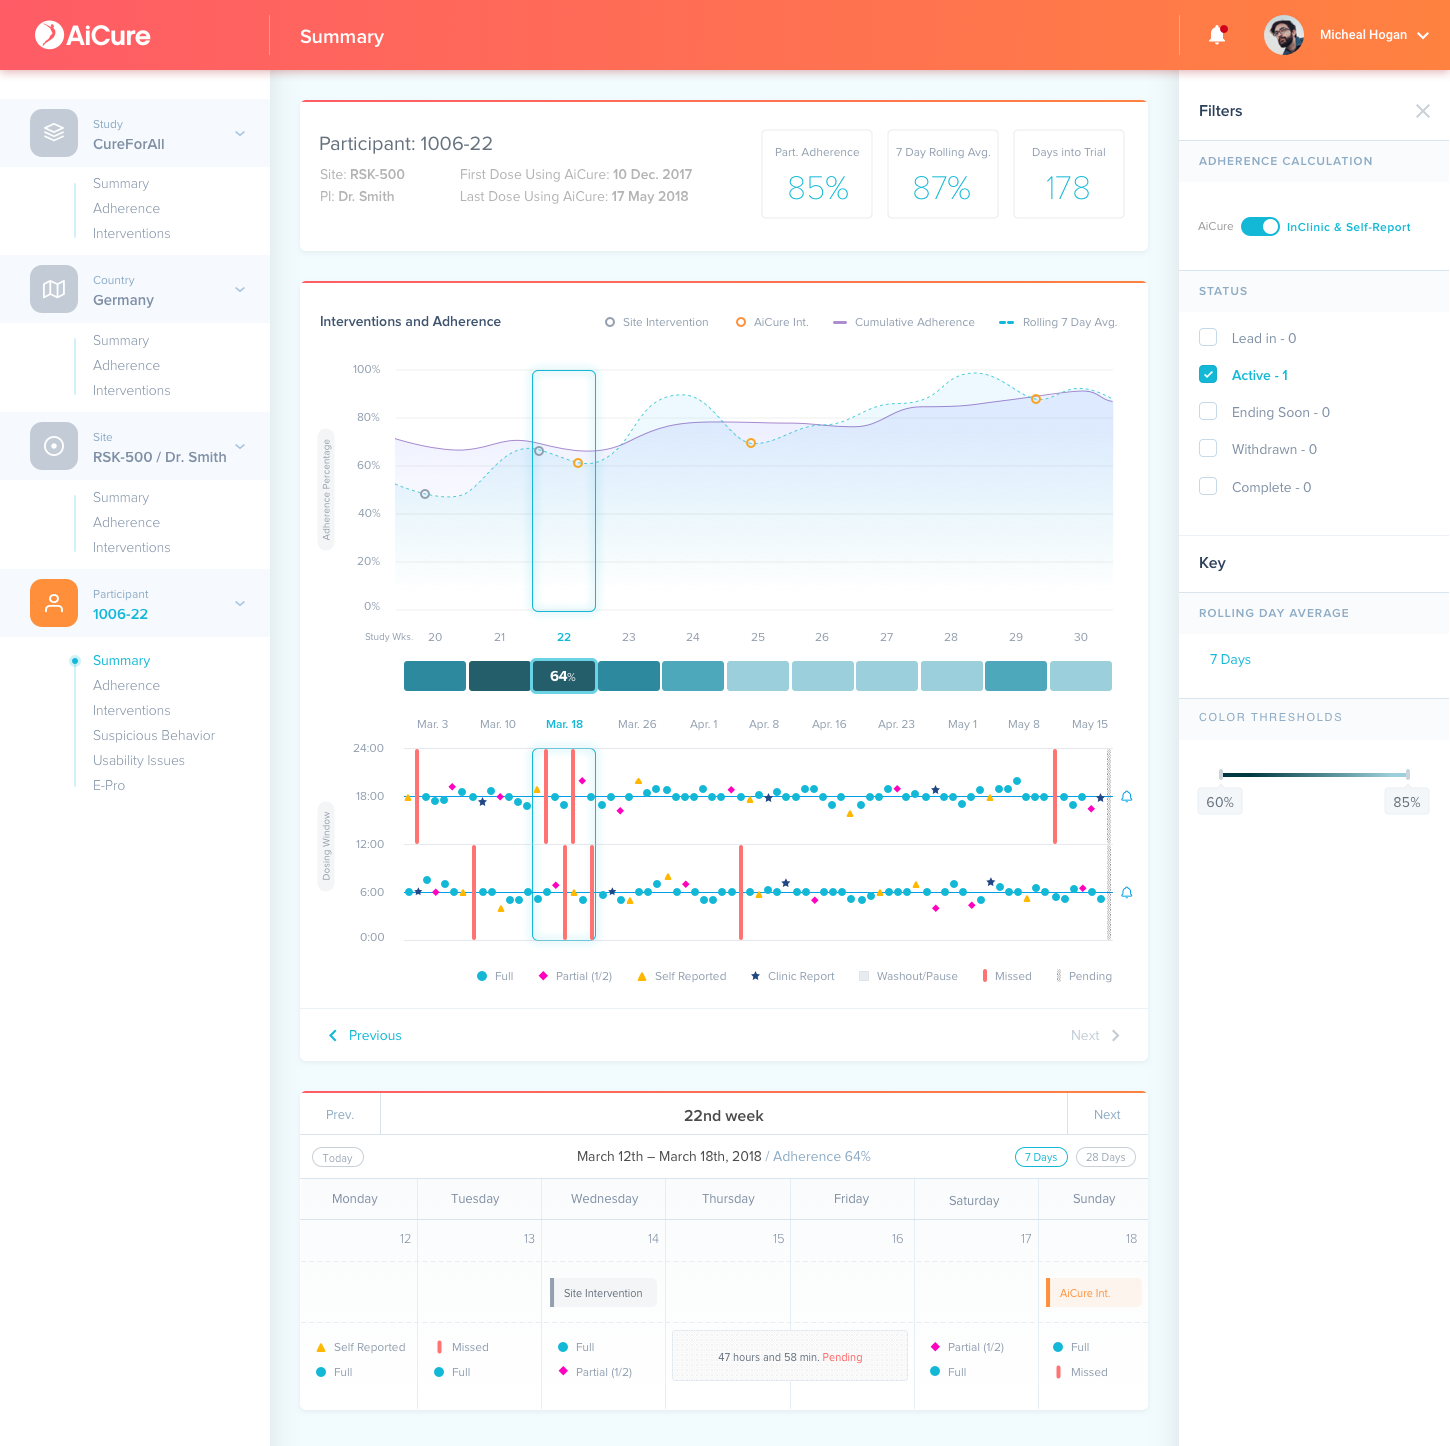
I built a unified platform around the five visualization priorities the research surfaced. The clinical dashboard gave trial teams real-time visibility across studies, countries, sites, and individual participants — with heat-maps, trend views, and intervention logs designed to surface the right information to the right person at the right level of detail.
The patient-facing app was redesigned around motivation and empathy — goal-setting, personalized notifications, and a task-based interface that reduced the cognitive burden of participation. Every interaction was grounded in what patients actually remember, what site staff actually have time for, and what sponsors actually need to act on.
Outcome
The platform gave AiCure's clinical teams unprecedented visibility into trial performance, reduced manual interventions, and improved adherence data quality. The patient app reduced in-person visits and increased trial engagement. The product contributed directly to AiCure's business growth. In clinical research, good design isn't just a UX problem — it's a data quality problem, a patient care problem, and a commercial problem, all at once.
Full design documentation available on request. Sensitive client information withheld for confidentiality.

AI Clinical Adherence & Data Visualization
My Role — Lead Product Designer · HAKEA for AiCure · 12 months · Deliverables: multi-role UX research, clinical dashboard, patient-facing app, app map, user archetypes, journey maps
The Problem
AiCure had built impressive computer vision technology for monitoring medication adherence in clinical trials — but no platform to make that data useful. Clinical teams were managing patients through phone calls and weekly email updates. The data existed. The insight didn't. HAKEA was brought in to design a clinical dashboard and patient-facing app for a complex, multi-role user base — from patients and nurses through to medical directors and trial sponsors.
The Research Approach
Rather than defaulting to the industry convention of five-user testing, I designed for broader coverage — drawing on evidence that small samples miss significant proportions of real user problems. Research ran across three parallel tracks: established data visualization theory and academic frameworks; competitive analysis mapped directly onto the user journey; and direct interviews across three user groups — patients managing complex medication regimes, site personnel supervising patients, and sponsors and medical directors overseeing multi-site trials.
From the research I produced affinity maps, user journey maps, detailed archetypes, and a comprehensive app map with feature recommendations.
Across all user groups, five shared needs emerged: population adherence at a glance, individual patient tracking, future trend prediction, difficulty identification across sites, and intervention management.
The Design Response
I built a unified platform around the five visualization priorities the research surfaced. The clinical dashboard gave trial teams real-time visibility across studies, countries, sites, and individual participants — with heat-maps, trend views, and intervention logs designed to surface the right information to the right person at the right level of detail.
The patient-facing app was redesigned around motivation and empathy — goal-setting, personalized notifications, and a task-based interface that reduced the cognitive burden of participation. Every interaction was grounded in what patients actually remember, what site staff actually have time for, and what sponsors actually need to act on.
Outcome
The platform gave AiCure's clinical teams unprecedented visibility into trial performance, reduced manual interventions, and improved adherence data quality. The patient app reduced in-person visits and increased trial engagement. The product contributed directly to AiCure's business growth. In clinical research, good design isn't just a UX problem — it's a data quality problem, a patient care problem, and a commercial problem, all at once.
Full design documentation available on request. Sensitive client information withheld for confidentiality.